 Building an NVR on the RK3588
Eight CPU cores, and the whole trick is keeping them idle.
Building an NVR on the RK3588
Eight CPU cores, and the whole trick is keeping them idle.
A network video recorder looks like a compute problem, and it isn’t. One 2880×1620 camera at 20 fps is 93 megapixels a second arriving at the box. Four of them is 373. If a general-purpose CPU core touches each of those pixels even once — to convert a colour space, to resize a frame, to copy a buffer from one library’s allocator to another’s — you have already lost, and no amount of clever C++ gets it back.
This is why an NVR built on a Raspberry Pi feels like a losing battle and an NVR built on an RK3588 feels almost unfair. The RK3588 is not a faster CPU. It is a CPU surrounded by fixed-function blocks that will move and reshape those pixels for you, and the entire design problem is arranging for the CPU never to be in the path.
What follows is a walk through that arrangement, with numbers. Everything measured here was measured on the box I actually run: an Orange Pi 5 (RK3588, 8 GB), Yocto rootfs, kernel 6.1.115, librknnrt 2.3.2 against RKNPU driver 0.9.8, librga 1.9.3, four cameras configured and two of them live at the time of measurement.
What is actually in the chip
People buy the RK3588 for “8 cores and 6 TOPS” but this is the only the tip of the iceberg. Here is the inventory that matters when you are moving video:
| Block | What it is | What it does for an NVR |
|---|---|---|
| 4× Cortex-A76 @ 2.304 GHz | the big cores | your code: parsing, tracking, post-processing |
| 4× Cortex-A55 @ 1.8 GHz | the little cores | network, HTTP, RTSP relay, housekeeping |
| VPU (via Rockchip MPP) | 2 decoder cores, plus JPEG and AV1 blocks | turns H.264/H.265 into NV12 |
| RGA | 2 cores, 2D raster accelerator | scale, crop, colour-convert, rotate, blend |
| NPU, 3 cores @ 1.0 GHz | inference engine | the detector |
| VOP2 + HDMI TX | display controller | the on-screen UI |
| Mali-G610 | GPU | nothing, deliberately — see the last section |
Every one of those blocks is a bus master in its own right, and each has its own IOMMU — this kernel enumerates nineteen of them, one per accelerator. They read and write DRAM through their own address translation, outside the CPU’s caches, so nothing they touch needs a core to copy it. Hand one a buffer by reference and it goes and fetches the pixels itself.
That is the design rule for the whole box: pass references, never pixels.
Step one: decode, and the cost of not using the VPU
The first thing a recorder does is turn a compressed stream back into frames. This is the single most expensive thing in the whole pipeline if you do it wrong.
I took a real clip off the box — 2240 frames of 2880×1620 HEVC, exactly what the camera sends — and decoded it flat out three ways. mppvideodec is the GStreamer element that drives the VPU; ffmpeg here is the same board’s software decoder, which is a perfectly good NEON-optimised one.
| HEVC 2880×1620, 2240 frames | Throughput | Wall time | CPU time | CPU per frame |
|---|---|---|---|---|
VPU (mppvideodec) |
747 fps | 3.00 s | 0.40 s | 0.18 ms |
| CPU, 8 threads | 183 fps | 12.23 s | 70.49 s | 31.47 ms |
| CPU, 4 threads | 156 fps | 14.32 s | 51.53 s | 23.01 ms |
| CPU, 1 thread | 47 fps | 47.73 s | 47.82 s | 21.35 ms |
The VPU decodes a frame for 0.18 milliseconds of CPU time; software costs 21 to 31, depending on how much thread overhead you buy. That is a factor of roughly 120. And the throughput column is almost beside the point: the VPU is four times faster and it does it at 13% of one core, while the software decoder is slower and saturates every core in the machine.
H.264 at 2560×1440 tells the same story with smaller numbers:
| H.264 2560×1440, 2500 frames | Throughput | CPU per frame |
|---|---|---|
VPU (mppvideodec) |
794 fps | 0.15 ms |
| CPU, 8 threads | 398 fps | 14.32 ms |
| CPU, 1 thread | 111 fps | 9.01 ms |
747 fps at 2880×1620 means the decoder alone would absorb roughly 37 such cameras at 20 fps. Decode, the thing that dominates a software NVR, has stopped being a line item.
There is one detail worth knowing before you celebrate. mppvideodec hands you an NV12 buffer whose real geometry is in the buffer’s GstVideoMeta, not in the caps. On this box, the HEVC camera negotiates caps that say stride 2880, and delivers buffers with stride 3328 and 1624 UV rows:
[4c4a3a2d…] frame path: DMA-BUF fd (zero-copy) 2880x1620
  layout caps[stride=2880,uvrows=1620] meta[stride=3328,uvrows=1624] → using meta
Trust the caps and you get a picture that is sheared, green, or both. Trust the meta and it just works. This is the sort of thing you find at 1 a.m.
Step two: RGA, and why the file descriptor is the whole trick
A detector does not want a 2880×1620 NV12 frame. It wants a 640×384 RGB tensor, aspect-preserved, padded with grey — a letterbox. Somebody has to do that resize, and it is exactly the “touch every pixel” operation we are trying to avoid.
RGA is the block for it. But how you hand it the frame changes the answer by an order of magnitude. I benchmarked the identical operation twice: once with the source in an ordinary malloc‘d buffer, once with the source as a DMA-BUF file descriptor — which is what mppvideodec hands you anyway, if you keep it.
| RGA op, source 2880×1620 NV12 | Source | Wall | CPU per op | Rate |
|---|---|---|---|---|
| letterbox → 640×384 RGB (detector input) | malloc | 4.80 ms | 1.058 ms | 208/s |
| letterbox → 640×384 RGB (detector input) | DMA-BUF | 3.41 ms | 0.125 ms | 293/s |
| crop+scale → 128×256 RGB (per-track ROI) | malloc | 1.75 ms | 0.977 ms | 573/s |
| crop+scale → 128×256 RGB (per-track ROI) | DMA-BUF | 0.34 ms | 0.043 ms | 2936/s |
| scale → 960×540 BGRA (a display tile) | malloc | 5.56 ms | 1.230 ms | 180/s |
| scale → 960×540 BGRA (a display tile) | DMA-BUF | 4.18 ms | 0.295 ms | 239/s |
Passing the fd instead of the pointer is an 8× reduction in CPU cost for the letterbox and 23× for the small crop. The wall time barely moves, because RGA was always going to take about as long. What disappears is CPU-side work that has nothing to do with resizing anything — and it is worth pinning down which work, because the obvious guess is wrong.
The obvious guess is cache maintenance: the accelerators are not in the CPU’s coherency domain, so somebody must clean the caches before RGA reads the buffer. The board ships a dedicated uncached heap to avoid exactly that, which makes the guess testable. Running the identical letterbox from each:
| Source of the same 2880×1620 NV12 frame | Wall | CPU per op |
|---|---|---|
malloc (virtual address) |
4.906 ms | 1.125 ms |
/dev/dma_heap/system (cached) |
3.440 ms | 0.136 ms |
/dev/dma_heap/system-uncached |
3.441 ms | 0.136 ms |
Cached and uncached are identical to the third decimal place. It is not cache maintenance. It is the page mapping: a virtual address must be pinned and walked into the RGA’s own IOMMU on every single call, while a DMA-BUF fd is already something that IOMMU knows about. The block was never the bottleneck. Your address space was.
For scale, here is the same letterbox done by OpenCV on the A76 cores of the very same board:
| Same letterbox, on the CPU | Wall | CPU |
|---|---|---|
OpenCV cvtColor + resize, 1 thread |
9.48 ms | 9.48 ms |
OpenCV cvtColor + resize, 4 threads |
2.86 ms | 11.45 ms |
OpenCV cvtColor + resize, 8 threads |
3.34 ms | 21.40 ms |
Note the trap in the last two rows: with four or eight threads OpenCV beats RGA on wall clock. It does it by spending 11 to 21 CPU-milliseconds — 90× to 170× what RGA-from-a-DMA-BUF spends — and by owning the entire machine while it does. On a box whose job is to run four of these concurrently plus a detector plus a web UI, “fast if you give it every core” is not fast.
RGA has one hard limit you will meet: 8× scaling in a single pass. It is not folklore, it is enforced by the driver. Probing it on the board, downscaling the same 2880-wide frame:
- to 384 wide (7.5×) — fine, 3.30 ms
- to 320 wide (9.0×) —
Failed to call RockChipRga interface
This is precisely why the detector input is 640×384 and not 320×192. 2880 → 640 is 4.5×, comfortably inside the window. Had we wanted 320, we would have needed two passes, and the design would have been worse for it.
One more thing RGA gives you for free: rotation. A camera mounted upside down does not need its video re-encoded or its stream rewritten — IM_HAL_TRANSFORM_ROT_180 is a usage flag on the letterbox that was already happening. Zero additional cost.
Step three: the NPU, and a result that surprised me
The detector is yolo11s-pose at 640×384, converted to fp16 RKNN. With the production worker stopped so the NPU was idle, single-inference latency by core mask:
| Core mask | mean | p50 | p95 | rate |
|---|---|---|---|---|
NPU_CORE_0 |
55.39 ms | 55.09 | 56.42 | 18.1/s |
NPU_CORE_1 |
65.37 ms | 56.66 | 79.10 | 15.3/s |
NPU_CORE_2 |
63.35 ms | 56.66 | 78.93 | 15.8/s |
NPU_CORE_0_1_2 |
59.91 ms | 55.06 | 76.61 | 16.7/s |
NPU_CORE_AUTO |
55.05 ms | 55.07 | 55.22 | 18.2/s |
Look at CORE_0_1_2. Asking for all three cores to work on one inference does not make it faster. It is within noise of a single core.
That is a curiosity until you scale it up, at which point it becomes the most important number on this page. Running N independent model contexts concurrently — which is what a multi-camera NVR actually does — gives:
| Concurrent contexts | Aggregate throughput | Per-inference latency (mean / p95) |
|---|---|---|
1 × AUTO |
18.1 inf/s | 55.2 / 56.1 ms |
2 × AUTO |
33.6 inf/s | 59.4 / 60.0 ms |
3 × AUTO |
44.4 inf/s | 67.5 / 88.2 ms |
4 × AUTO |
49.4 inf/s | 80.8 / 100.7 ms |
3 × CORE_0_1_2 |
21.2 inf/s | 141.3 / 166.3 ms |
Three contexts on AUTO deliver 2.1× the throughput of three contexts pinned to all three cores, at less than half the latency. The three NPU cores are not a wide machine you feed one problem; they are three machines you feed three problems. Pin nothing, dup a context per camera, let the runtime place them. The single line rknn_set_core_mask(ctx, RKNN_NPU_CORE_0_1_2) — which reads like the obviously-optimal choice — costs you more than half your NPU.
The pipeline, assembled
Put the three blocks in a row and the shape of the thing falls out. One RTSP connection per camera, parsed once, decoded once, and then RGA fans that single decoded buffer out to everyone who wants a look at it.
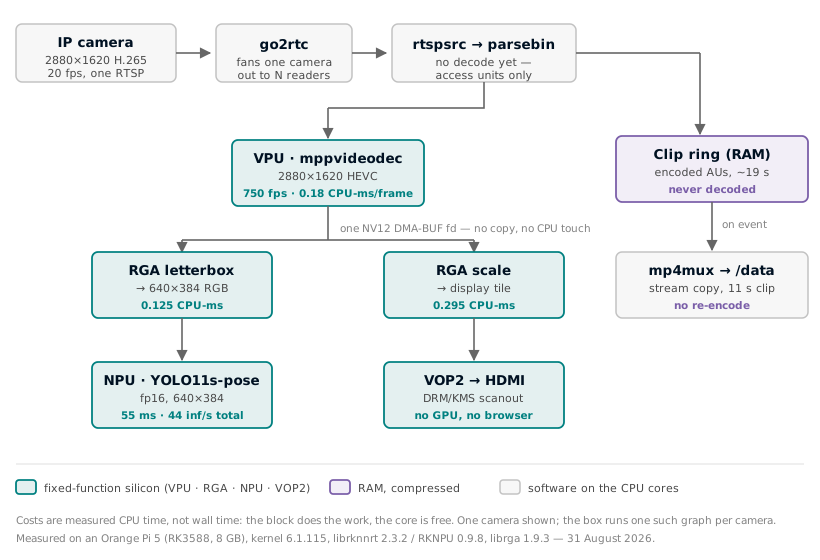
The costs on that diagram are CPU-milliseconds, not wall-milliseconds. That distinction is the entire argument: the wall time is spent by a block that is not the CPU, and the core it would otherwise have occupied is free to do something a CPU is actually good at.
The CPU-side work that remains is real, and it is worth naming: RTSP session handling, H.264/H.265 parsing (not decoding — finding access-unit boundaries), NMS and pose-keypoint decoding on the detector’s output tensors, tracking, and the web API. That last cluster is why the production units are split across the two CPU clusters:
# zenbox-worker.service
# RK3588 is big.LITTLE: cpu0-3 = A55 (1.8 GHz), cpu4-7 = A76 (2.4 GHz). The
# worker's per-frame post-processing (NMS + pose-keypoint decode) is latency-
# sensitive and gates NPU throughput, so pin the whole worker to the four A76
# big cores. The backend/go2rtc are pinned to the A55 cores so web/network work
# never preempts a detection post-process off a big core.
CPUAffinity=4 5 6 7
Post-processing gates the NPU: while a core is doing NMS on frame N, it is not submitting frame N+1. That makes it latency-sensitive in a way that HTTP handling is not, and big.LITTLE gives you somewhere to put each.
You do not need the camera’s substream
Received wisdom in the NVR world is that you run detection on the camera’s low-resolution substream, because you cannot afford to decode and downscale the mainstream. On this hardware that wisdom is simply obsolete, and I would go further: on a small grid the mainstream is the better source.
The numbers above already say it. Decoding the mainstream costs 0.18 CPU-ms per frame; at 20 fps that is 3.6 CPU-ms per second per camera — a third of one percent of one core. The RGA downscale to detector input costs 0.125 CPU-ms. A substream would save you essentially nothing, and it would cost you a second RTSP session to the camera and a second decode.
Which is why the worker logs this at startup:
[4c4a3a2d…] started (unified mainstream): rtsp://127.0.0.1:8554/4c4a3a2d…
One connection, one decode, and RGA generates every derived view the box needs — the detector’s 640×384 letterbox, the per-track crops, the display tile — straight out of that one NV12 buffer. If you want a “substream”, you make it yourself, for 0.125 milliseconds, and you never encode it because nothing off-box ever asks for it.
There is a practical argument too, and it is the one that finally settled it for me: not every camera has a substream. Three of the four cameras configured on this box report an empty substream_uri — an RTSP camera added by hand usually offers exactly one stream. A design that requires a substream has a hole in it. A design that generates its own does not.
The one place the old wisdom survives is dense display grids: at 3×3 and beyond the tiles are small enough that a substream is roughly native resolution, and reusing an already-decoded buffer saves a decode. At the 2×2 grid this device ships, a typical 704×576 substream would have to be upscaled into a 960×540 tile. The mainstream wins on quality and costs a rounding error.
Recording: a ring of compressed frames
An NVR has to answer “what happened just before the alarm?”, and the honest answer requires having kept the seconds before you knew anything was wrong. The naive version of this is continuous recording, which is a disk-space problem and a write-endurance problem on an eMMC-based appliance.
The version that works keeps a ring buffer of encoded access units in RAM — never decoded, never re-encoded:
// Pre-roll ring of ENCODED mainstream access units for one camera.
// Units are stamped with wall-clock arrival time (CLOCK_REALTIME, same clock
// as the backend's event_ts) rather than media PTS, so a save() window needs
// no PTS↔wall-clock correlation. On save() the units from the last keyframe at
// or before the window start through the window end are muxed (copy, no
// re-encode) into an mp4.
Three decisions in there earn their keep:
It rings the compressed bitstream. The ring holds 19 seconds — 5 s pre-roll + 5 s post-roll + 5 s guard + 4 s slack — at roughly 2 Mbit/s, so a few megabytes per camera. Ringing decoded frames instead would be 7.0 MB per frame — the ring would not survive a second.
It stamps wall-clock time, not PTS. An event arrives from the detector with an epoch timestamp. If the ring were indexed by media PTS you would need a correlation between the two, maintained across every stream restart, forever. Stamping arrival time with the same clock the events use makes save(t0, t1) a trivial deque scan, and stream restarts stop mattering.
It muxes by copy. On an event the ring walks back to the last keyframe at or before the window start and pushes those units through appsrc → parse → mp4mux → filesink. No decode, no encode, no quality loss, and the VPU is not touched at all. The clips on the box right now are 11.2-second, 2.8 MB HEVC files at full 2880×1620 — the camera’s own bytes, cut at a keyframe. Twenty-five of them come to 51.6 MB.
The corollary is that the box records nothing until something happens, and when something does happen the evidence is already several seconds old.
The screen: a TV UI with no GPU and no browser
The last block is the display, and it is where I had the most fun being wrong.
The requirement was an on-screen UI on a TV, driveable by the TV’s own remote over HDMI-CEC. The obvious answer is Chromium in kiosk mode, and the obvious answer is terrible: hundreds of megabytes of RSS, a GPU dependency, and a compositor, all to draw nine rectangles and a clock.
What we built instead is a DRM/KMS client that owns the display directly: dumb buffers, a software signed-distance-field rasteriser for text and rounded rectangles, RGA compositing the video into the tile rects, and raw struct input_event for the remote. No GL, no EGL, no libgbm, no compositor, no browser. The Mali GPU on this box idles at 300 MHz and is never asked to do anything — which is exactly the point, because the display path already has enough silicon in it.
Some things learned in the doing, all measured:
“No HDMI signal” was never a fault. The firmware ships a complete display stack — VOP2 and dw-hdmi bound, EDID read, 37 modes up to 4096×2160 — and zero DRM clients. Nothing ever requested a modeset, so the transmitter stayed off. A stdlib-only DRM ioctl script that does a modeset and paints colour bars flipped debugfs from Video Port0: DISABLED to ACTIVE / 1920x1080p60 and put a picture on the TV. No kernel rebuild, no device-tree change.
The CEC remote is gated on the vendor ID. Three runs with every documented precondition met — logical address claimed, TV ACKing, active source announced, live picture — and zero key events. The TV will not forward <User Control Pressed> to a device it cannot identify, and at vendor_id 0 the kernel Feature-Aborts <Give Device Vendor ID>. Registering the TV’s own vendor id produced 24 keys immediately. (Back arrives as UI command 0x2C/CLEAR, not 0x0D/EXIT, which is its own afternoon.)
The framebuffer is mapped write-combining, and that is a 50× cliff. Sequential writes are fast; reads miss everything. The rasteriser reads the destination on every blended pixel — a menu scrim, text antialiasing, a translucent chip. Measured on the board, writing straight to the scanout buffer: an opaque pixel costs ~3 ns, a blended pixel ~155 ns. Same memory, same loop. That is why a full-screen menu took 1.1 seconds to repaint while the mostly-opaque camera grid felt fine. The fix is to render into a cached shadow buffer and memcpy the damaged rows out to scanout.
Repainting 4K once a second to move a clock costs a whole core. systemd reported Consumed 9min 43.300s CPU over 11.5 minutes of idle. The clock displays HH:MM; repainting only when the displayed minute changes took idle CPU from 80% to 0%.
Together with damage-rect rendering and splitting the SDF rasteriser into flat spans plus corner patches (a 4K frame went from 20.71 ms to 3.53 ms on the dev host, bit-identical output), the end state on a 3840×2160 panel is:
| Interaction | Before | After |
|---|---|---|
| Menu open | ~1160 ms | ~30 ms |
| Menu selection | ~1160 ms | 3 ms |
| Grid focus move | — | 6.5 ms |
| Cursor move | — | below measurement |
| Idle CPU | 80% | 0% |
One consequence of compositing video straight into the scanout buffer is that RGA flattens any chrome sharing its destination rect — the camera name chip and the tile’s rounded corners. Those get copied back out of the shadow afterwards, which is a sequential write and nearly free. It also means the name chip reads as composited against the tile background rather than against live video: cheaper, and considerably more legible for it.
Where the budget actually goes
Here is the box in its normal state — two live cameras, detector running, web UI up, sampled over 90 seconds:
--- per-core busy% (cpu0-3 = A55 @1.8GHz, cpu4-7 = A76 @2.4GHz) ---
  cpu       6.8%
  cpu0      5.6%    cpu4      9.5%
  cpu1      5.2%    cpu5      8.2%
  cpu2      5.9%    cpu6      6.9%
  cpu3      4.4%    cpu7      9.1%
--- top processes by CPU (% of ONE core) ---
     31.4%  zenbox_worker_c      21.3%  python3 (backend)      1.4%  go2rtc
--- NPU load, mean over window ---
  Core0: mean  93.5%   Core1: mean  70.1%   Core2: mean   0.0%
--- temps degC ---
  soc=62.8  bigcore0=61.9  bigcore1=62.8  littlecore=62.8  gpu=61.9  npu=62.8
6.8% of the machine. Two 2880×1620-class streams being decoded, letterboxed, inferred on, tracked, rung into a pre-roll buffer and served over HTTP, and seven and a half of the eight cores are asleep, with the SoC sitting at 63 °C.
And then look at the NPU line. Core 0 at 93.5%, Core 1 at 70%. That is the binding constraint, and it is the only one. Work the ceilings out from the measurements:
| Resource | Measured ceiling | Cameras it supports (20 fps, 2880×1620) |
|---|---|---|
| VPU decode | 747 fps | ~37 |
| RGA letterbox | 293 op/s | ~14 at full frame rate |
| NPU | 44 inf/s | ~2 at full rate, ~8 at 5 fps detection |
Everything the folk wisdom tells you to worry about — decoding, resizing, colour conversion, memory bandwidth — has been engineered into irrelevance by blocks that cost a fraction of a millisecond of CPU. What is left is the model, and the only two levers on it are which model you run and how many frames per second you actually need to look at. That is a much better problem to have. It is also, notably, the only problem you can solve by thinking rather than by buying a bigger board.
The third NPU core, incidentally, is sitting at 0%.
Reproducing any of this
None of the measurements above are estimates or scaled-from-elsewhere figures, and none of them need my code to reproduce:
- Decode:
gst-launch-1.0 filesrc location=X ! qtdemux ! h265parse ! mppvideodec ! fakesink sync=falseagainstffmpeg -threads N -i X -f null -, timed withgetrusage(RUSAGE_CHILDREN). Note that/dev/mpp_service,/dev/rgaand/dev/dma_heap/*are root-only on a stock Yocto rootfs. - RGA: a short C++ program against
librga’sim2dAPI —wrapbuffer_fdversuswrapbuffer_virtualaddrintoimprocess, withgetrusage(RUSAGE_SELF)around the loop. librga’s own failure dump prints the rects and formats it received, which is how you confirm you built the request you meant to. - NPU:
rknnlite,init_runtime(core_mask=…), random NHWC uint8 input, 20 warm-up iterations, 200 timed. The concurrency table is N threads each with its own context. - Steady state: deltas of
/proc/statand/proc/<pid>/stat, plus/sys/kernel/debug/rknpu/loadsampled at 2 Hz.
The board is an off-the-shelf Orange Pi 5. The models are stock yolo11s-pose converted with the standard RKNN toolkit. If your numbers differ from mine, I would genuinely like to know — particularly on the CORE_0_1_2 result, which I re-ran three times before I believed it.
A note on how this was written: the prose of this article was created with the help of AI, working from my build history, my source tree and my notes. Every measurement in it is real. They were taken on the running hardware described above on 31 August 2026 — not estimated, not extrapolated, and not borrowed from a datasheet — and every one of them can be independently verified by anyone with an RK3588 board and the commands listed in the section above.